 When Gantt Charts where first created in the early 1900’s, they were considered very revolutionary, but these days there are a lot of software packages that allow you to easily create one – although a Gantt Chart in Excel is probably the most flexible and customizable of all Gantt Chart solutions.
The Excel Gantt Chart we made available free of charge on our website today is about 3 years old now, and had many improvements along the way. I personally have used this very template to plan all sorts of projects, from product launches through to operational planning in a distribution center. Our helpdesk also helped customers who have subscribed to our Microsoft Office helpdesk modify it to their needs – for example, one subscriber has used it to plan the subjects and exams for the school year at their school.
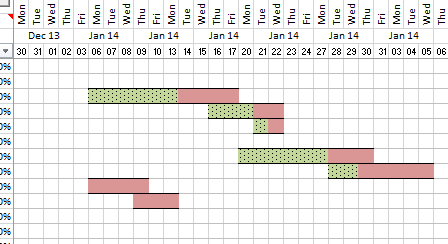
The chart itself has columns for tasks, start date, duration, end date, assigned to and completed. Once you have entered this information, the chart will plot the details of the task into the Gantt Chart in the format of a horizontal bar that extends for the duration of the task. The colour of the bar will change depending on whether the tasks is completed or not.
Since its available free of charge, the best thing would be for you to register, download it and try it out for yourself.

Article by Matthew Steele – LinkedIn Profile